How to Easily Master On-Chain Data for Beginners (2026)
How to Read On-Chain Data for Beginners: A Non-Trader’s Framework (2026)
I’m not a trader. I’m a Korean office worker who got tired of reading crypto headlines without being able to check them myself. That’s why I started learning how to read on-chain data for beginners like me — people with a normal job, a ChatGPT Plus subscription, and zero appetite for staring at candlestick charts at 2 a.m.
This post is the framework I wish someone had handed me a year ago. By the end you’ll have a five-layer mental model for reading the chain, a thirty-minute Etherscan walkthrough, and a fifteen-minute weekly routine that fits around a real job.
No price predictions. No signals. Just literacy.
How to Read On-Chain Data for Beginners: What It Actually Is (Without the Trader Jargon)
On-Chain data is the public ledger of every blockchain transaction. Every transfer, every contract call, every mint and burn is recorded permanently and is readable by anyone with a browser.
That’s the whole concept. The reason it feels intimidating is that the surface area is huge:
- Sender and receiver addresses
- Amounts and token contracts
- Timestamps and block numbers
- Gas paid and gas used
- Function calls (the “what did this transaction actually do” part)
- Event logs (the receipts that contracts emit)
- Internal transfers triggered by contracts
The data itself is plain. The hard part is knowing which pieces matter for the question you’re asking. According to the Ethereum.org developer docs, every Ethereum transaction is a signed instruction that mutates the global state — and that state is what we mean by “the chain.”
On-Chain vs Off-Chain. Price on Binance is off-chain — it lives on a private order book. The moment someone withdraws ETH to a personal wallet, that movement is on-chain. Confusing the two is the first mistake most beginners make.
Why a Non-Trader Should Care: Three Reasons That Aren’t “Make Money Fast”
Top search results for this keyword are written for traders chasing alpha. That’s not who this post is for. Here’s why a working professional with no trading ambition should still learn how to read on-chain data for beginners.
One: fraud resistance. When a friend forwards you a “guaranteed yield” pitch, opening Etherscan to check the contract age, the deployer wallet, and the actual token holders takes ninety seconds. The Chainalysis 2024 Crypto Crime Report makes the case: a huge share of losses come from contracts that anyone with basic literacy could have flagged.
Two: news literacy. When a headline says “a whale moved $200M,” you can open the transaction and see whether the receiving address is a known exchange hot wallet (boring), a bridge (more interesting), or a fresh wallet (worth a second look). Reading the chain turns clickbait into a fact-check.
Three: long-game compounding. Reading on-chain data is a skill that doesn’t decay. Models change. Tools change. But the ledger — addresses, transactions, contracts — has been stable since 2015. Same framework-first bet as the no-code AI agent pillar — substrate, not season.
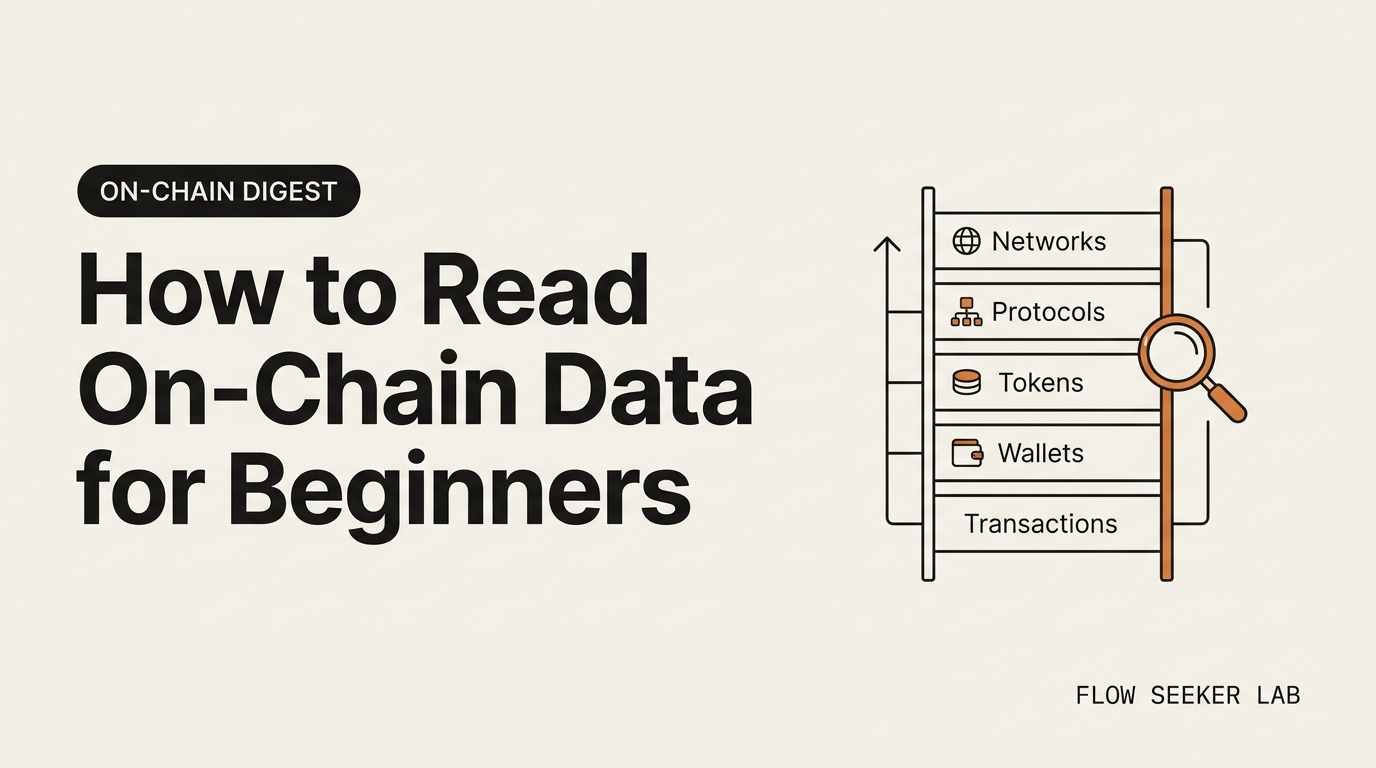
A 5-Layer Framework: How to Read On-Chain Data for Beginners, Step by Step
Here’s the spine of the post. Most beginner guides throw twenty metrics at you in random order. I think about the chain as five stacked layers, from concrete to abstract.
| Layer | What you read | Best free tool | Typical question |
|---|---|---|---|
| 1. Transactions | One action at a time | Etherscan | What did this transaction do? |
| 2. Wallets | A single address’s full history | Etherscan, Debank | Who is this counterparty? |
| 3. Tokens | One token’s holders and flows | Etherscan token page, Dune | Is supply concentrated? |
| 4. Protocols | A whole app’s usage | Dune dashboards, DeFiLlama | Is this protocol actually used? |
| 5. Networks | A whole chain’s behavior | Glassnode Studio (free tier), Dune | Is the network healthy? |
You climb the ladder. You start with a single transaction, then zoom out to the wallet behind it, then to the token, the protocol, and finally the network. That order matters. People skip straight to network-level metrics like MVRV or NUPL and end up with no idea what they’re actually measuring. Climb the ladder first.
Layer 1: Mastering Transactions (On-Chain Data for Beginners)
A transaction tells you what happened in one block, in one action. Sender, receiver, value, function, gas. Pasting any transaction hash into Etherscan gives you the full receipt.
Layer 2: Wallets
A wallet is the history of one address — inflows, outflows, contracts touched, NFTs held. This is where you decide if a counterparty is a normal user, an exchange, a contract treasury, or a freshly funded mystery wallet.
Layer 3: Tokens
A token has a holder distribution, a creation date, a contract source. The top-50 holders alone tell you most of what you need to know about concentration risk.
Layer 4: Protocols
A protocol is a set of contracts that together do something — a DEX, a lending market, a bridge. The question is usage: daily active users, deposits, withdrawals. Dune is the easiest no-code path here, as the Dune docs explain.
Layer 5: Networks
The network is the whole chain — active addresses, fees burned, exchange netflow. Glassnode Academy has plain-English definitions for each metric at academy.glassnode.com.
Your First 30 Minutes on Etherscan: How to Read On-Chain Data for Beginners in Practice
Etherscan is free, needs no account, and covers most of layers 1 through 3. If you only learn one tool, learn this one. The official Etherscan tutorials are a decent reference, but here’s how I’d spend my first thirty minutes.
Minutes 0–5: Look up your own wallet. Paste any address you control into Etherscan’s search bar. Notice the columns: hash, method, block, age, from, to, value, fee. Hover over “method” — that’s the function called on the contract.
Minutes 5–15: Open a single transaction. Click any hash. Read the receipt top to bottom. The fields that matter most for a beginner: Status (success or failure), Block, From, To, Value, Transaction Fee, and the “Tokens Transferred” line. Click “More Details” and then “Click to see Logs” — those event logs are the receipts the contract emitted.
Minutes 15–25: Inspect a token contract. Find any token you’ve heard of and click through to its contract page. Look at: total supply, holders, transfers, the contract source (verified or not), and the deployer address. A token whose contract is not verified is a yellow flag. A token whose top 10 holders own 90% of supply is another yellow flag.
Minutes 25–30: Trace a path. Pick a transaction where tokens were transferred and follow the receiver to its wallet page. Then pick one of its recent transactions and follow it again. Two hops is usually enough to see whether a flow is heading to a centralized exchange, a known smart contract, or into the void.
That’s it. Thirty minutes and you’ve read more on-chain data than most people who post about crypto. Small, repeated reps on a free tool — that’s the practical core.
When Etherscan Isn’t Enough: Dune and Glassnode Free Tier
Etherscan is per-transaction and per-wallet. Once you start asking aggregate questions — “how many active users did this protocol have last week?” — you need a different tool.
Dune is a community SQL-and-dashboards platform. The killer feature for non-coders is that thousands of public dashboards are already built. You can fork, edit, and run them without ever writing SQL. Search “Uniswap volume” or “stablecoin supply” and you’ll find dashboards maintained by working analysts.
Glassnode sells professional analytics, but the Glassnode Academy and the free Studio tier expose enough metrics for a beginner. Use it to look up plain definitions before you trust any chart someone screenshots at you. “Exchange netflow,” “MVRV,” “NUPL” — Glassnode’s free content explains each one in flat English.
Free-tier limits, honestly. Dune rate-limits free queries. Glassnode’s free tier hides advanced metrics. Neither matters for a beginner — you’ll cover ninety percent of what you need without paying. If you feel pressure to upgrade in the first three months, that’s the same trap I wrote about in why I stopped chasing new tools.
What Broke: Three Things I Misread on the Chain in My First Month
Mandatory FLOW SEEKER LAB section. The faster you read this list, the faster you avoid the same dents I put in my own confidence.
Mistake 1: I read an “exchange outflow” as bullish. I saw a huge ETH outflow from a major exchange and told a friend it was a “supply shock.” Two days later I learned the exchange was just rotating funds between its own hot and cold wallets. The movement was real. The story I attached was fiction. Lesson: an outflow without destination context is just a number.
Mistake 2: I confused a contract with a user. I followed a wallet receiving millions in stablecoins and assumed whale accumulation. It was a router contract for a DEX aggregator — every swap flowed through that address. Lesson: before telling a story about a wallet, check for the “Contract” tag on Etherscan. When you’re ready to follow a single address over time, here’s the no-code workflow for how to track a crypto wallet step by step.
Mistake 3: I trusted the holder count on a brand-new token. A token I was researching showed 8,000 holders, which felt like organic traction. When I sorted by balance, the bottom 7,500 holders each held one wei — airdropped dust to inflate the number. Lesson: holder count is meaningless without a balance distribution.
If you skip all three, you’re already ahead of where I was after a month.
A Weekly 15-Minute On-Chain Review Routine
Daily on-chain checking is noise. Weekly is enough for a non-trader. This is the routine I give anyone asking how to read on-chain data for beginners without making it a second job — Sunday morning, fifteen minutes.
- Minute 0–3: Check one network-level metric. I look at active addresses on Ethereum for the last seven days. Up, flat, or down — I write one word in a notebook. That’s it.
- Minute 3–6: Check one stablecoin metric. Total USDC and USDT supply on Ethereum. Growing supply is roughly a proxy for capital sitting on-chain waiting to do something.
- Minute 6–10: Open one Dune dashboard. I rotate between a DEX dashboard, a lending dashboard, and a bridge dashboard. One per week.
- Minute 10–13: Audit one wallet. Either a wallet someone mentioned to me during the week, or one I bookmarked. Climb the ladder: transaction → wallet → counterparties.
- Minute 13–15: Write three lines. What did I notice? What changed? What’s one thing I don’t understand yet?
Fifteen minutes. No charts to stare at. No alerts to silence. Compound this weekly for six months and you will read the chain better than most people who claim to do it for a living. I wrote more about why this cadence works in the bases-before-bets piece — the same principle applies.
Limits and Honest Warnings
On-Chain data is powerful but not omniscient. Three honest caveats before you read with confidence.
Mixers, bridges, and CEX deposits hide flows. When tokens enter a centralized exchange or a privacy mixer, the on-chain trail ends. You see them go in. You don’t see where they come out. Many “whale movement” headlines lose their story at this boundary.
MEV and bot activity inflate numbers. A lot of volume on busy chains is automated arbitrage and liquidations — bots talking to bots. Raw transaction counts and DEX volume include this noise.
Correlation is not causation. Exchange netflows turning negative before a price move doesn’t mean one caused the other. Resist the urge to attach narratives to single charts. The Wikipedia entry on blockchain analysis is a fair neutral primer on what this analysis can and cannot do.
FAQ
What is on-chain data, in one sentence? On-chain data is the public ledger of every blockchain transaction — every transfer, contract call, and state change that the network has permanently recorded.
Do I need to know how to code to read on-chain data? No. Etherscan and public Dune dashboards cover about eighty percent of what a beginner needs, and neither requires writing a single line of code. Glassnode’s free tier adds another layer.
Is on-chain data the same as crypto price data? No. Price data mostly lives on centralized exchanges and is off-chain. On-chain data is wallet and contract behavior on the blockchain itself. They answer different questions and should not be confused.
What’s the single most useful on-chain metric for a beginner? Exchange netflow or active addresses, depending on the question. Netflow tells you whether capital is moving onto or off of trading venues. Active addresses tells you whether the network is being used by humans and bots in aggregate.
How often should a non-trader check on-chain data? Once a week, for fifteen minutes, is plenty. Daily checking turns into pattern-matching on noise. Weekly checking lets actual trends emerge.
Can on-chain data predict price? No. Anyone selling you a chart that promises price prediction is selling, not building. On-chain data is for literacy and fact-checking, not forecasting.
Is reading public wallets a privacy violation? No. Blockchain addresses are pseudonymous by design — they’re public information. The privacy boundary is the identity behind the address, which on-chain data alone doesn’t reveal.
Closing
Reading the chain is a literacy skill, not a trading skill. That’s why I wrote this guide on how to read on-chain data for beginners — an entry point without a finance degree. Climb the five layers. Spend thirty minutes on Etherscan. Run the weekly review.
Next in this series — On-chain Digest #2: How I Built My First Etherscan Watchlist Without Spreadsheet Hell — the actual no-code system I use to track ten wallets and three protocols, no SQL, no paid tools.
About the author
seonjae — Korean office worker documenting his transition into AI systems, agents, and vibe coding — without a CS background. Shipping in public.